 India
India  Mongolia
  Sweden
  Australia
Executive Summary: The Hidden Cost of Solar Asset Degradation
Your energy yield reports show a gap between projected and actual output. The gap has been there for months. No single panel has tripped an alarm – the losses are distributed, silent, and cumulative across dozens of strings. That is how solar portfolio degradation typically works, and it is precisely why a solar panel defect detection solution has become an operational priority for asset managers and O&M teams working at scale.
Traditional inspection schedules and inverter-level monitoring leave wide windows where defects compound unseen. An AI-driven solar panel defect detection solution closes those windows by combining continuous SCADASupervisory Control and Data Acquisition – industrial software that collects and monitors real-time performance data from inverters, strings, and plant equipment performance analysis, targeted thermal inspection, and multimodal data fusion. The result is not simply better visibility. It is an operational discipline that connects defect identification directly to prioritised repair actions – turning a passive monitoring exercise into a measurable energy recovery workflow.
Why Do Solar Panel Faults Keep Draining Revenue Without Anyone Noticing?
Solar panels degrade silently – small defects bleed energy continuously without triggering any monitoring alarm.
Context: The Operational Reality of Solar Asset Management
Utility-scale and large commercial solar portfolios span vast physical areas, often covering hundreds of acres with tens of thousands of individual panels operating across dozens of inverter strings. Operations teams typically monitor performance through inverter-level data, which provides limited resolution into individual panel behaviour. Solar panel fault detection at module level sits below the threshold of standard string-level alerts – meaning defects that affect a single cell or a small cluster of panels within a string often produce losses too small to flag automatically.
However, across a large portfolio, those sub-threshold losses accumulate into a significant, sustained revenue gap. In practice, organisations relying on inverter monitoring and annual inspection cycles typically discover that a material fraction of their underperformance has no clear timestamp – nobody can say when the fault developed, because no system was watching at the right resolution.
Key Pain Points This AI Solution Addresses
- Undetected solar panel faults accumulate silently – defects including hotspotsLocalised areas of elevated temperature on a solar panel surface, caused by shading, cell damage, or bypass diode failure, which reduce panel output and can become a fire risk if unaddressed, microcracks, and delaminationThe separation of internal bonding layers within a solar panel module, typically caused by moisture ingress, which degrades electrical performance over time develop between inspection cycles, compounding revenue loss with no automated detection path.
- Manual solar inspection delays extend the window between fault development and repair – in many portfolios, the gap between detection and resolved work order runs to weeks or months, during which the defect continues degrading output.
- False positives in solar defect detection from simplistic threshold-based alerts dispatch maintenance crews to healthy panels, wasting field time and eroding team confidence in automated systems.
- Solar panel performance loss from soiling alone can reach up to 7% of annual generation output, according to the NREL Photovoltaic Module Soiling Map, which tracks soiling losses across 255 U.S. locations – a loss class that is fully recoverable but frequently under-monitored.
- Expensive drone inspection workflows – often costing several hundred dollars per megawatt – are logistically complex at scale and difficult to justify for small operators, creating uneven inspection frequency across large fleets.
- Poor visibility into solar asset health across multi-site portfolios forces O&M teams into reactive maintenance postures, responding to problems after they escalate rather than catching them while they are still low-cost to address.
- Potential Induced Degradation (PID)A form of cell-level efficiency loss caused by voltage leakage between the solar cell and module frame, typically driven by humidity and high system voltages, that is invisible to standard monitoring, snail trails, and early-stage delamination are among the rarest defect classes – with limited real-world training data – making detection less consistent than for common fault types.
Why Traditional Approaches Fall Short
Standard inverter monitoring captures performance at the string and inverter level, but cannot localise which specific panel within a string is underperforming or identify root cause. A 2% string-level underperformance flag tells an operator something is wrong – not what, not where, and not whether it is worth dispatching a crew today or next month.
Manual thermographic surveys require trained technicians, specialised equipment, and favourable weather conditions. Scheduling these at meaningful frequency across large portfolios is a logistical challenge that most teams resolve by accepting longer inspection cycles. Annual schedules create 12-month windows where defects compound with no intervention.
Even when drone inspections take place, the resulting image data typically lives in a separate system from SCADA and weather data. Connecting a detected hotspot to a specific measurable energy loss – and therefore to a prioritised maintenance decision – requires manual cross-referencing that few teams have the analyst capacity to do consistently.
In practice, organisations deploying manual inspection workflows typically encounter a critical last-mile problem: the defect gets detected, a report gets filed, but no automated path exists to convert that finding into a prioritised work order with verified economic impact. The defect keeps draining revenue while the report waits in a queue.
What Is a Solar Panel Defect Detection Solution and How Does It Differ from Simple Monitoring?
A solar panel defect detection solution combines performance analysis with visual inspection intelligence to find, verify, and prioritise faults.
Rather than replacing manual inspection entirely, a well-designed solar panel defect detection solution functions as a decision-making layer between raw sensor data and field action. It integrates machine learningA branch of AI in which systems learn patterns from historical data to make predictions or decisions on new data without being explicitly programmed for each case performance analysis, targeted aerial inspection, and multimodal data fusion into a single intelligence engine. The system tells operations teams not just what is wrong, but which faults to fix first – ranked by measurable economic impact, not by detection order.
The key architectural difference from basic monitoring is this: the solution starts from performance loss, not from imagery. Images serve as a verification layer for anomalies already flagged by telemetry – not as the primary detection method. This design choice directly addresses the false positive and actionability problems that image-only inspection systems consistently generate in field deployments. Real-time solar panel anomaly detection becomes credible when it is grounded in performance data first, visual evidence second.
Vision and Objectives
- Detect underperforming assets earlier than inverter-level monitoring allows, reducing the window during which defects compound without intervention
- Reduce false positive rates that drive unnecessary truck rolls, by requiring cross-signal confirmation before any maintenance dispatch is triggered
- Connect defect detection directly to repair prioritisation, so the highest-impact faults reach field crews first rather than working through issues in detection order
- Unify SCADA telemetry, drone inspection outputs, weather data, and site maintenance history into a single operational view across the full portfolio
- Enable inspection-on-demand rather than fixed-schedule surveys, so drone flights target only zones where performance data indicates a probable fault
- Measure verified energy recovery after each repair, transforming inspection from a reporting activity into a business function with quantifiable output
Real-World Application Scenarios
These three scenarios show how the solution operates across distinct operational contexts and portfolio scales.
Utility-Scale Solar Farm Operations (50 MW+)
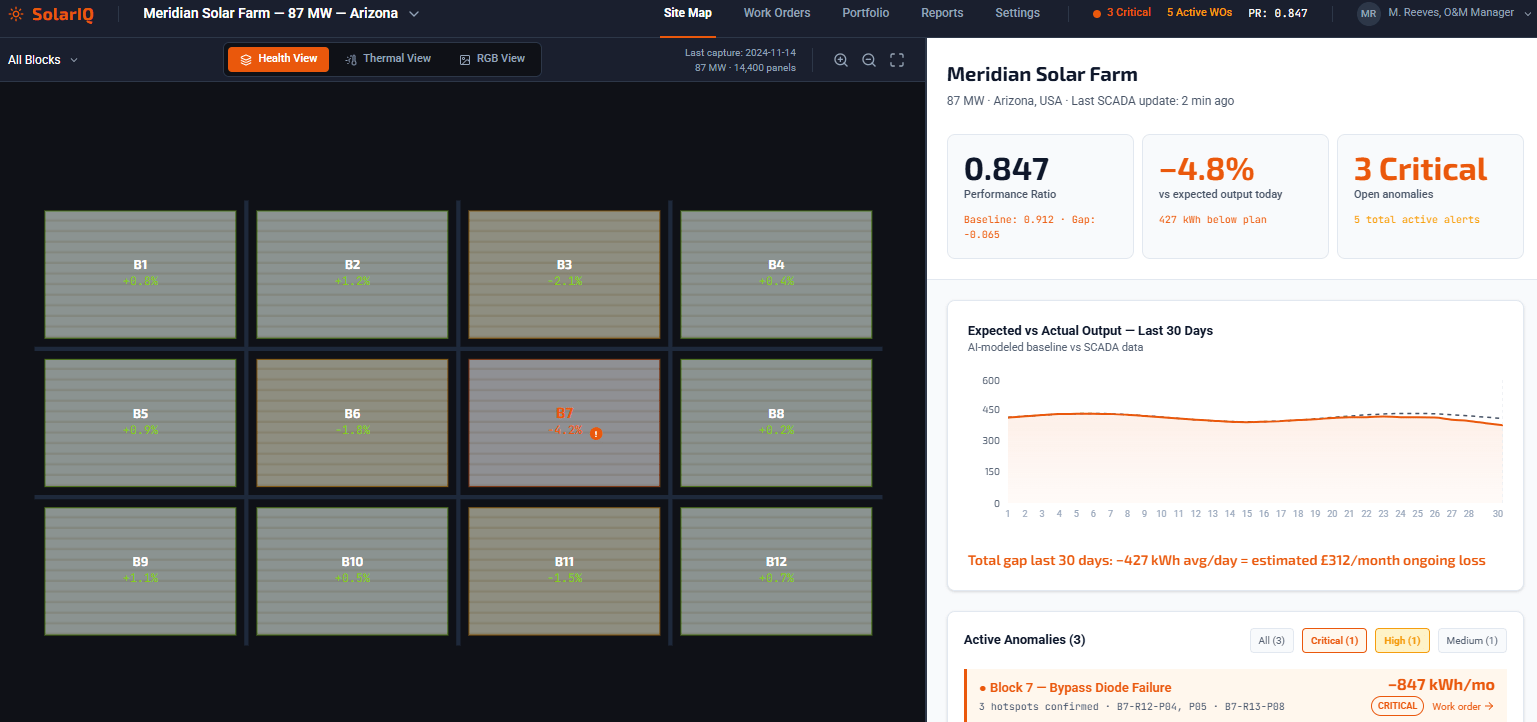
Your inverter dashboard shows a 4% underperformance flag on Block 7 – but the next scheduled site visit is three weeks away.
A farm of this scale may contain 150,000 or more individual panels across dozens of inverter circuits. Traditional inspection schedules cannot match the frequency needed to catch developing hotspots or soiling clusters before they compound into sustained revenue loss. Manual thermographic inspection across this footprint requires multiple crew days and specific weather windows.
The AI solar panel inspection layer monitors SCADA performance continuously, identifies the specific string cluster most likely driving the underperformance, and triggers a targeted drone mission for that zone only. Thermal processing links each detected hotspot back to panel coordinates and calculates estimated energy loss. The operations team receives a work order specifying which panels to inspect, what fault type to expect, and the projected kWh recovery from the repair – before deploying anyone to site.
Outcome: Targeted inspections replace full-site surveys, cutting field time while recovering verifiable energy yield.
Large Commercial and Industrial Rooftop Operations
You manage a 300 kW rooftop system on a distribution centre, and generation has tracked below projections for six consecutive months with no clear explanation.
For commercial operators, solar is a cost-reduction tool – not a core business focus. Internal facilities teams lack the expertise to interpret inverter data beyond basic uptime checks. Scheduling an inspection means arranging access, hiring specialists, and coordinating around building operations.
A solar panel defect detection solution using continuous SCADA monitoring identifies that soiling on the south-facing array is the primary driver of the production gap. It calculates the projected payback period for professional cleaning, compares it against the ongoing energy loss rate, and generates a prioritised recommendation with an economic justification. The facilities manager receives a clear, justified action – no deep technical knowledge required.
Outcome: Specific, economically justified recommendations replace unexplained performance gaps and speculative specialist engagements.
O&M Contractors Managing Multi-Site Portfolios
You are responsible for performance across 15 client sites, coordinating drone operators, maintenance crews, and monthly reporting deadlines simultaneously.
Multi-site O&M contractors face coordination complexity that single-site operators do not. Each client uses different monitoring systems, different panel technologies, and different contractual performance thresholds. Manually compiling performance reports and scheduling inspections across 15 sites stretches analyst capacity thin, and client reporting quality suffers.
Solar farm inspection software with a portfolio-level dashboard gives the O&M team a unified view of underperformance across all sites, ranked by estimated revenue impact. Automated inspection triggers notify drone partners only when performance data justifies a flight. Structured defect reports feed directly into client-facing documentation, eliminating much of the manual effort involved in producing monthly performance summaries.
Outcome: Portfolio-level intelligence replaces site-by-site manual analysis, freeing analyst capacity and improving reporting consistency.
Ready to explore what this solution looks like for your organisation?
Talk to Our AI TeamHow Does a Solar Panel Defect Detection Solution Actually Work?
The solution works through a layered pipeline – from performance data ingestion through to verified work order output – not a single image analysis step.
Understanding the architecture matters for buyers evaluating this category, because the most common failure mode in solar inspection software is treating visual defect detection as the primary layer rather than the verification layer. What follows describes a pipeline designed around operational outcomes first – energy recovery, reduced false dispatches, and repair prioritisation – rather than around detection accuracy as an end in itself.
Data Acquisition: What the System Ingests
The system ingests data from multiple concurrent sources. SCADA telemetry provides string-level and inverter-level production data at regular intervals. Weather feeds supply irradiance, ambient temperature, wind speed, and humidity aligned to the same timestamps. Plant topology files define the physical and electrical hierarchy – site, block, inverter, combiner box, string, and panel group. Drone or handheld thermal and RGB image outputs connect via mission management APIs or direct file ingestion. Optional electroluminescence (EL) imageryA specialised imaging technique in which a current is applied to a solar panel in darkness, causing it to emit faint light that reveals internal structural defects such as microcracks not visible to standard cameras supports deeper diagnostics for specific defect investigations, though it is not practical for routine field operations.
What implementation experience reveals that theoretical explanations often miss is how much of the early deployment effort goes into data normalisation rather than model tuning. Real plants have inconsistent sensor naming conventions, clock drift between data sources, missing topology records, and SCADA exports in varying timestamp formats. Resolving these data quality issues before building any model is what separates deployments that generate actionable outputs from ones that generate noise.
The AI Processing Pipeline

- Asset Onboarding and Data Integration – The system imports the full plant topology, mapping every inverter, combiner, string, and panel group to a canonical asset graph. Each incoming data source – SCADA, weather station, inspection outputs – is mapped to this graph and assessed for completeness, timestamp consistency, and sensor reliability. No analytics begin until data quality baselines are established for every connected source.
- Baseline Performance Modeling – Using historical production data, irradiance readings, module temperature, tracker angle, and seasonal patterns, the system builds expected-power models at site, inverter, and string level. These models produce a continuously updated expected output for every monitored asset under actual current conditions. Deviations between expected and actual output form the primary anomaly detectionThe automated identification of data patterns that deviate significantly from established normal behaviour, used here to flag solar assets whose output is unexpectedly lower than conditions warrant signal – and critically, they distinguish genuine faults from legitimate production variation caused by weather, shading, or curtailment.
- Anomaly Detection and Triage – A layered detection engine processes performance data continuously. Deterministic rules catch obvious faults: offline inverters, zero-current strings, impossible sensor readings, and tracker failures. Gradient boostingA machine learning technique that builds an ensemble of decision models in sequence, with each model correcting the errors of the previous one, producing strong predictive accuracy on structured tabular data and temporal ML models then detect subtler patterns – gradual underperformance trends, mismatch signatures, and intermittent fault behaviour. Each flagged event receives a classification covering likely fault family: soiling, shading, electrical fault, sensor error, or unknown. Keeping an “unknown” state is deliberate – forcing confident classification on every anomaly is a fast path to false positives and broken trust.
- Inspection Trigger and Mission Planning – The system does not dispatch a drone for every anomaly. For each flagged event, it calculates whether a physical inspection is economically justified – weighing estimated energy loss, confidence level, asset criticality, available weather windows, and crew availability. If justified, it automatically generates a targeted mission plan specifying which zone to inspect, what altitude and camera mode to use, and what time window offers optimal thermal capture conditions. This calculation is what converts a detection system into an asset management tool.
- Image Capture and Processing – Thermal and RGB imagery captured by drone or handheld device feeds into the vision processing layer. The system runs panel localisation, row-level georeferencingThe process of assigning precise geographic coordinates to image data, enabling each captured frame to be mapped to a specific physical location within the solar site layout, thermal normalisation against ambient conditions, and defect inference. Each detected anomaly – hotspot, crack, soiling pattern, delamination signature – is linked directly to a specific panel or panel group within the asset graph, not just to a coordinate in a photo folder.
- Multimodal Fusion and Defect Verification – This is where performance intelligence and visual evidence combine. SCADA data identifies which zone is underperforming. Thermal data confirms whether a hotspot or temperature asymmetry is present. RGB imagery shows whether visible damage, dirt, or shading objects explain the reading. Site history indicates whether this is a new fault, a recurring issue, or a pattern previously repaired. The multimodal fusionA technique that combines evidence from multiple independent data sources – performance telemetry, thermal imagery, visual imagery, and maintenance history – to produce a single, higher-confidence diagnostic conclusion engine outputs a verified diagnosis with an estimated energy loss figure, a recommended action, and a confidence score that drives the next decision.
- Action Ranking and Work Order Generation – Not every detected issue triggers a dispatch. Only findings that exceed a configurable economic and confidence threshold generate work orders. Each work order includes the panel location, thermal and RGB evidence, likely fault type, estimated energy impact, recommended action, urgency level, and any relevant safety flags. Low-confidence or novel findings route to analyst review rather than automatic dispatch. This policy – keeping a human review step for uncertain cases – is what preserves field crew trust in the system over time.
- Closure Loop and Outcome Learning – After a technician completes a repair, the system captures structured feedback: what was actually found, what was fixed, what parts were used, and how long the repair took. Post-repair telemetry then tracks whether production recovered as expected. This outcome data – verified recovery or non-recovery – becomes the most reliable retraining signal for the detection and ranking models, creating a continuous improvement loop grounded in real-world repair outcomes rather than just labelled image datasets.
Human-in-the-Loop: Where Human Judgment Still Matters
- Anomaly triage routes events to human review when confidence scores fall below defined thresholds – particularly for rare defect classes like PID or early-stage delamination where model performance is less established
- High-cost actions – module replacement, string rewiring, structural repair – require analyst sign-off before a work order is issued, regardless of model confidence level
- Inspection mission plans are reviewed before deployment to confirm weather conditions, crew availability, and site access align with the proposed flight window
- Technician field feedback after each repair is structured and human-provided, ensuring closure data reflects on-site observation rather than automated inference
- Portfolio-level performance dashboards surface trend data for operations managers, maintaining human oversight of long-term asset health patterns across all connected sites
Output and Interaction: How Results Are Delivered
Operations managers view a geospatial portfolio dashboard showing each site’s current performance status, open anomaly events ranked by estimated revenue impact, and the status of active work orders. Field crews access task-level mobile views with location maps, fault evidence images, recommended repair steps, and a structured completion form that feeds directly back into the closure loop.
Client reporting workflows pull from verified case data, reducing the manual effort of compiling monthly performance summaries. Where supported, API integrations push work orders directly into CMMSComputerised Maintenance Management System – enterprise software used to schedule, track, and record maintenance activities, work orders, and asset service histories platforms so maintenance records stay within the customer’s existing operational systems rather than sitting in a separate solar-specific dashboard.
What Technologies Power AI Solar Panel Inspection?
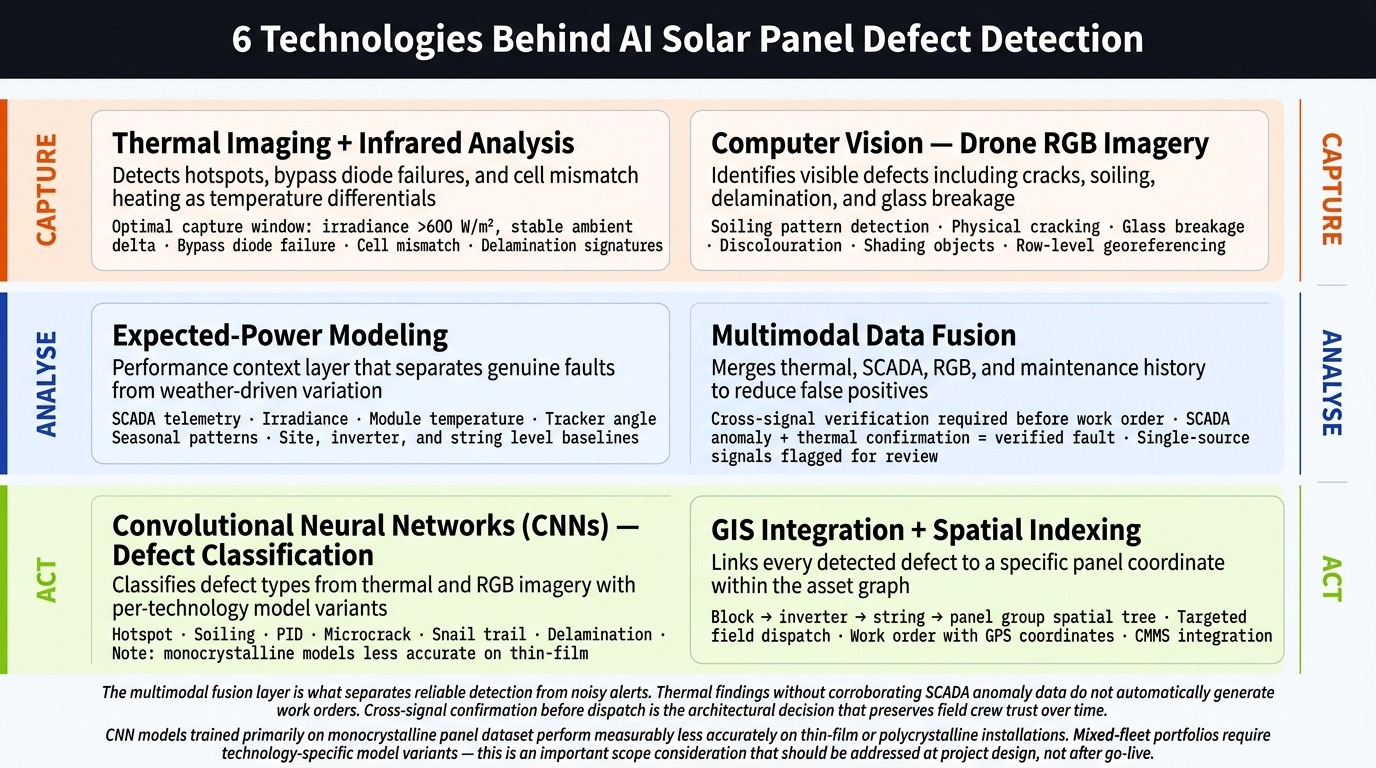
AI solar panel inspection depends on six core technologies working in combination – no single technology alone is sufficient for reliable, actionable results.
- Computer Vision (CV)AI techniques enabling automated interpretation of visual imagery by identifying patterns, objects, and anomalies across pixel data – applied here to detect cracks, soiling, and structural defects in drone imagery – Identifies visible panel defects including cracks, soiling patterns, delamination, and glass breakage from drone RGB imagery, covering ground that would require multiple days of manual close-inspection to match at equivalent scale.
- Thermal Imaging and Infrared AnalysisInfrared camera technology that captures surface temperature variations invisible to the naked eye, used here to reveal hotspots, bypass diode failures, and electrical anomalies across solar panel surfaces – Detects hotspots, bypass diode failures, and cell mismatch heating patterns as temperature differentials against surrounding panel surfaces. Thermal solar panel inspection requires specific operating conditions – adequate irradiance and a stable temperature differential between panel surfaces and ambient air – making capture window scheduling a critical part of reliable results.
- Expected-Power ModelingPhysics-informed machine learning models that predict what a specific solar asset should produce under current environmental conditions, used to calculate performance deviations that indicate potential faults – Provides the performance context layer without which raw telemetry cannot reliably distinguish genuine faults from legitimate production variation. This layer is what makes SCADA-based solar panel anomaly detection meaningful rather than noisy.
- Multimodal Data FusionA technique that merges evidence from multiple independent data streams – SCADA telemetry, thermal imagery, RGB visual data, and maintenance history – into a single, higher-confidence diagnostic conclusion – Merges thermal findings, photovoltaic defect detection classifications, SCADA performance signals, and site maintenance history into one verified assessment. This fusion step reduces false positives that single-source systems consistently generate by requiring cross-signal evidence before triggering any action.
- Convolutional Neural Networks (CNNs)A class of deep learning models designed for image analysis, using stacked filter layers to identify spatial patterns – applied here to classify specific defect types including cracks, hotspots, and soiling across solar panel imagery – Underpin the photovoltaic defect detection models that classify defect types from thermal and RGB imagery. Performance varies by panel technology – models trained on monocrystalline datasets perform measurably less accurately on thin-film installations, which is an important scope consideration for mixed-fleet portfolios.
- GIS Integration and Spatial IndexingGeographic Information System tools that manage the spatial coordinates and layout of every panel within a site, enabling detected defects to be linked to precise physical locations rather than approximate zones – Links every detected defect to a specific panel within the asset graph, enabling targeted field dispatch rather than zone-level guidance. Without this spatial layer, inspection outputs cannot drive precise maintenance actions – they can only indicate a general area of concern.
What Results Does a Solar Panel Defect Detection Solution Actually Deliver?
A solar panel defect detection solution primarily delivers measurable energy recovery and reduced field costs – not just better inspection reports.
- Earlier detection of undetected solar panel faults reduces the compounding period for each defect – recovering energy yield that would otherwise remain lost until the next scheduled inspection cycle. The difference between detecting a hotspot cluster in week two versus month six is quantifiable in lost kilowatt-hours.
- Targeted inspection triggers driven by performance anomalies replace full-site drone surveys, reducing unnecessary inspection coverage for assets showing no performance deviation and concentrating field effort where it matters most.
- Multimodal fusion cuts false positives in solar defect detection by requiring cross-signal confirmation before any maintenance dispatch – thermal findings without corroborating SCADA data do not automatically generate a work order. This directly reduces the truck-roll waste that erodes O&M budgets and team confidence in detection systems.
- Solar panel anomaly detection operating continuously eliminates the blind spot between manual survey events, providing operations teams with a living view of asset health rather than a snapshot from the last inspection date.
- Verified post-repair outcome tracking transforms the inspection function into a measurable business activity – energy recovery becomes a reportable metric that demonstrates the return on O&M investment to financial stakeholders.
- Automated work order generation directly from defect evidence eliminates the manual step of converting inspection reports into actionable maintenance tasks, reducing the delay between defect verification and repair dispatch.
- For O&M contractors, an AI solution for solar panel hotspot detection and portfolio-level performance monitoring enables consistent multi-site oversight that manual workflows cannot practically deliver at equivalent frequency or cost.
- Economic prioritisation of repair actions ensures that field crew time targets the faults with the greatest measurable revenue impact first, rather than working through issues in the order they were detected.
Is a Solar Panel Defect Detection Solution Worth the Investment?
For portfolios of 10 MW or larger, the business case is strongest when built around verified energy recovery – not inspection cost reduction alone.
Enterprise buyers need a framework to justify deployment internally. Rather than citing headline figures that may not reflect your specific operating environment, the most reliable approach is to identify the four business metrics most directly affected by this solution and measure them before and after implementation.
Key Metrics to Measure Before and After Deployment
- Energy Recovery Rate – Track the gap between projected and actual generation at string and inverter level before deployment. After implementation, measure how that gap closes as detected faults are verified and repaired. This is the clearest measure of whether the system is functioning as intended.
- Inspection Cost per MW – Calculate the current annual cost of manual or drone survey cycles per MW of installed capacity. Compare this against AI-triggered targeted inspections that cover only anomaly-flagged zones. The reduction in uninstructed inspection activity has a direct budget impact.
- False Dispatch Rate – Count how many current maintenance callouts result in no actionable finding – the crew arrives and finds a healthy panel or a non-fault condition. A high false dispatch rate indicates a system generating excessive solar defect detection noise. Reducing it measurably cuts truck-roll costs and restores field crew trust.
- Mean Time to Resolution – Measure the average time from probable fault development to verified repair completion under the current process. Manual inspection delays extend this window considerably. AI-driven detection and automated work order generation compress it.
Realistic Timeline and Payback Expectations
A common pattern across real implementations of this solution is that energy recovery drives the dominant ROI at scale, while inspection cost reduction is a significant secondary benefit – but neither arrives immediately. For a mid-size operator, realistic timelines typically involve three to five months of data quality validation, baseline modeling, and staged model activation before the anomaly detection layer is generating reliable, trusted outputs.
The payback window shortens considerably as portfolio size increases. At utility scale, the annual energy loss from a single undetected string underperformance cluster – compounding over months – can exceed the cost of a full deployment cycle. The business case for acting now rather than waiting rests on one calculation: every month without a functioning solar panel defect detection solution is a month where existing defects continue compounding at their current rate.
The ROI case weakens when the customer has weak SCADA data quality, a very small system size, or limited appetite to integrate findings into a genuine maintenance workflow. The solution is not a passive monitoring tool – it delivers return when operations teams act on what it surfaces.
What Does Deploying a Solar Panel Defect Detection Solution Actually Require?
Successful deployment requires clean, connected data more than advanced AI – poor data quality remains the most common project failure point.
Where This Solution Has Real Limits
- Thermal solar panel inspection quality depends directly on environmental conditions. Cloud cover, low irradiance windows, and high winds degrade thermal contrast and produce unreliable results. No AI model compensates for a poor capture session – weather window management is a genuine operational constraint.
- Models trained primarily on monocrystalline panel datasets perform measurably less accurately on thin-film or polycrystalline installations. Rare defect classes – PID, snail trails, early-stage delamination – have limited real-world labelled training data, making detection less consistent than for common types like hotspots and soiling.
- Residential and sub-1 MW rooftop systems typically do not justify full drone-plus-AI inspection economics. The per-MW cost structure favours utility-scale and large commercial portfolios significantly over small-site deployments.
- Technician adoption can fail independently of model quality. If work orders lack precise location data, clear supporting evidence, or plain-language recommended actions, field crews default to their own judgment – and the feedback loop that makes the system improve over time breaks.
Practical Factors to Plan For
- Data quality and completeness – SCADA telemetry with inconsistent timestamps, missing sensor records, or partial topology mapping significantly reduces model reliability. A structured data audit before deployment determines the true scope and timeline of the baseline modeling phase.
- Asset topology mapping – Every inverter, combiner box, string, and panel group requires a consistent canonical identity that maps to both performance data and inspection imagery. Incomplete or inconsistently named topology is the most frequently underestimated factor in live deployments of this type – and it must be resolved before analytics produce trustworthy outputs.
- Integration complexity – Connecting to customer SCADA systems, CMMS platforms, drone data exports, and weather data APIs involves vendor-specific protocols, data formats, and access permissions that vary significantly between sites and equipment generations.
- Weather and capture window management – Thermal inspection deployments require planning around seasonal irradiance windows and local weather patterns. Setting expectations around inspection coverage regardless of conditions creates friction with customers when capture quality is poor.
- Model calibration over time – Detection models require periodic recalibration as panel degradation patterns shift with age, as new panel types are added to a portfolio, and as real-world repair outcome data accumulates through the closure loop.
- Data residency and compliance requirements – Large energy operators often have strict rules governing where operational telemetry can be processed and stored. Deployment architecture must accommodate on-premise or private cloud requirements where applicable – this is a non-negotiable scope item for regulated markets.
- Phased rollout discipline – Attempting full deployment across all fault classes and all sites simultaneously is a consistent failure mode. Teams that have worked through this integration consistently find that a staged approach – connecting sources first, validating topology, establishing baselines, deploying rules before ML models – produces reliable outputs by weeks eight to twelve and avoids the trust damage caused by noisy early-phase outputs.
Who Gets the Most Value from a Solar Panel Defect Detection Solution?
This solution delivers the highest return to operators managing portfolios of 10 MW or more across utility-scale or large commercial sites.
The ideal operational profile is a team managing significant installed capacity where manual inspection cannot realistically match the detection frequency that automated performance monitoring provides – and where performance losses carry real financial consequences. Solar farm inspection software at this scale serves utility-scale independent power producers, large commercial energy buyers, and O&M contractors managing multi-client portfolios. Contractors gain portfolio efficiency; asset managers gain client reporting confidence; commercial buyers gain measurable ROI visibility on a capital asset that must perform consistently over a 25-year lifespan.
This Solution Is Particularly Valuable If:
- You operate or manage 10 MW or more of installed photovoltaic (PV)Technology that converts sunlight directly into electricity using semiconductor materials – the core technology in solar panels, used here as a general term for solar panel arrays and their associated equipment capacity across one or more sites
- Your current monitoring relies primarily on inverter-level SCADA data without panel-level or string-level defect visibility for solar panel fault detection
- You manage multiple sites and currently spend significant analyst time on manual performance report compilation and inspection scheduling
- You need to justify maintenance investment decisions to financial stakeholders using energy recovery data rather than inspection activity counts
- You are experiencing recurring false positive alerts that have eroded field crew trust in your existing monitoring or detection system
Industry Contexts Delivering Clear Value
- Utility-scale independent power producers and their contracted O&M partners
- Large C&I operators with on-site renewable generation above 500 kW where solar asset performance directly affects energy cost targets
- Solar asset management firms handling client portfolios across multiple geographies and panel technologies
- EPC contractors delivering commissioned plants and transitioning into long-term operations and maintenance agreements
Frequently Asked Questions About Solar Panel Defect Detection
These questions cover how the solution works, what it reliably detects, and what realistic deployment looks like.
How does a solar panel defect detection solution work?
A solar panel defect detection solution works through a layered process that starts with SCADA performance analysis rather than imagery. The system first builds expected-output models for each inverter and string under actual weather conditions, then flags deviations as candidate fault events. When a performance anomaly meets the threshold for physical investigation, the system generates a targeted inspection mission plan rather than dispatching based on a fixed schedule. Thermal and RGB imagery feeds a vision processing layer that detects and classifies specific defect types – hotspots, cracks, soiling, delamination – and links each finding to its precise location in the asset map. The final output is a prioritised work order with economic impact data, not just an image report.
Can AI detect solar panel hotspots using thermal imaging accurately?
Detecting hotspots is one of the most reliable applications of AI solar panel inspection using thermal data. Hotspots appear as localised temperature elevations above surrounding panel surfaces, and infrared cameras capture these differentials clearly under appropriate operating conditions. AI models identify abnormal thermal signatures against baseline panel temperatures and classify them by severity and likely cause – bypass diode failure, cell damage, shading, or soiling. However, reliable thermal solar panel inspection requires specific environmental conditions: adequate irradiance, a stable temperature differential between panels and ambient air, and minimal wind. Capture session planning around these windows is a critical part of a high-accuracy hotspot detection workflow.
What is the best approach to solar panel defect detection using thermal imaging for large-scale plants?
For utility-scale plants, solar panel defect detection using thermal imaging works most effectively as a verification layer rather than a standalone primary detection method. The recommended approach starts with SCADA-based performance monitoring to identify which zones are underperforming, then deploys thermal inspection only to those flagged areas. This design reduces total inspection cost while focusing thermal capture on zones where anomalies are most likely to be confirmed. Photovoltaic defect detection accuracy improves significantly when thermal findings are fused with SCADA performance data and RGB visual evidence – rather than relying on thermal imagery alone. Single-source thermal-only workflows are more prone to false positives from reflection artefacts, irradiance variation, and environmental interference.
Is solar farm defect detection software worth it for utility-scale plants?
Solar farm defect detection software for utility-scale plants is most economically justified for portfolios above 10 MW, where manual inspection cannot match the detection frequency that automated performance monitoring provides and where the revenue impact of undetected faults accumulates faster than the cost of the software. The economic case weakens for sub-1 MW rooftop systems, where per-site inspection economics make a full drone-plus-AI workflow difficult to justify relative to system value. For mid-to-large portfolios, the key metric is verified energy recovery after repair – not inspection cost savings alone. ROI also depends heavily on whether operations teams are willing to act on detected findings and integrate the system into actual maintenance workflows rather than treating it as a dashboard tool.
How does photovoltaic panel crack detection using computer vision compare to manual inspection?
Photovoltaic panel crack detection using computer vision identifies microcracks and surface fractures that are invisible to the naked eye under standard visual inspection conditions. Computer vision models trained on labelled crack datasets can evaluate thousands of panels in a single drone flight, covering ground that would require multiple days of manual close-inspection to match. However, detection accuracy varies by panel technology – models trained primarily on monocrystalline datasets perform less reliably on thin-film installations. Very small cracks in early development stages also remain challenging for current detection models, and these cases are typically flagged for human analyst review rather than automatically classified. Manual expert inspection retains an advantage for ambiguous or structurally complex cases, which is why human oversight remains a design requirement rather than an afterthought in a well-built system.
Build This Solution With Softlabs Group
Softlabs Group builds custom solar panel defect detection solutions designed around the operational reality of your specific sites, data sources, and maintenance workflows – not around a generic product template. Our engineering team handles the full technical stack: SCADA ingestion and canonical asset graph construction, baseline performance modeling, anomaly detection and inspection trigger logic, thermal and RGB image processing, multimodal fusion, and work order integration with your existing CMMS and reporting systems. We approach this as enterprise AI development for energy operations – which means data quality, workflow integration, and human oversight design receive the same engineering attention as model architecture. The inspection trigger and orchestration layer we build functions as an AI agent workflow – coordinating performance analysis, inspection scheduling, defect verification, and work order dispatch within a single automated decision loop.
If you manage a solar portfolio where manual inspection is no longer keeping pace with scale – or where alert noise is eroding team confidence in your current monitoring system – we can scope a solution that fits your data environment, your operational structure, and your target fault classes. The first step is a technical conversation about your current monitoring setup, your SCADA data availability, and the performance gaps you most need to close. From there, we define a realistic build roadmap together.