 India
India  Mongolia
  Sweden
  Australia
Executive Summary: The Problem Isn’t Speed – It’s Trust
An underwriter who can’t explain a risk score to a regulator doesn’t use it. That’s the real reason most AI-powered property risk assessment solution projects fail – not bad technology, but scores that arrive without evidence.
The underwriter overrides the system. The project gets shelved. The insurer goes back to manual assessment that is slow, inconsistent, and still missing the majority of property-level risk signals that only multi-source data pipelines can surface.
An AI-powered property risk assessment solution built correctly solves a different problem than most vendors claim. It doesn’t just score properties faster. It produces a score an underwriter can stand behind – showing which roof features were detected, from which imagery date, against which hazard data layer – with a structured audit trail attached.
That’s the difference between a tool that gets adopted and one that costs $2 million and gets bypassed.
Why Does Property Risk Assessment Keep Producing Decisions Nobody Can Stand Behind?
The core problem isn’t that manual property assessment is slow. It’s that the data it produces is incomplete, inconsistent, and often wrong by the time a decision gets made on it.
The Operational Reality of Manual Property Risk Assessment
A commercial lines underwriter receives a property submission. The broker-supplied COPE data says “good roof condition, concrete frame, no prior losses.” The underwriter has no practical way to verify any of it before the quote deadline.
So they price from the broker’s representation – and every year, a meaningful percentage of those representations turn out to be wrong in ways that show up as unexpected losses at claims time.
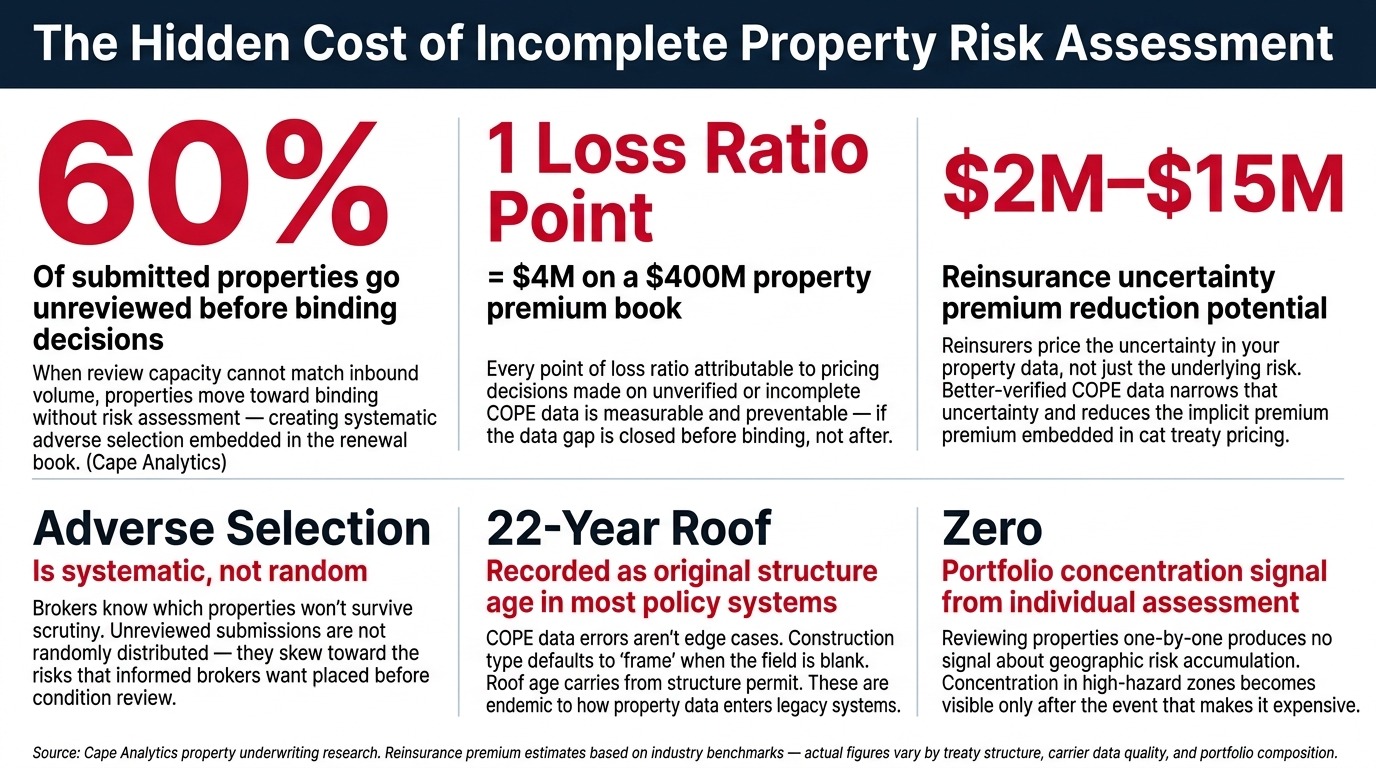
The submission queue compounds the problem. When 60% of submitted properties go unreviewed before binding decisions are made, carriers are not selecting risk – they are accepting it.
The properties that slip through unreviewed are not randomly distributed. Brokers know which properties won’t survive scrutiny. Information asymmetry between broker and carrier is not a theoretical concern. It is a systematic adverse selection engine running inside every high-volume underwriting operation.
In practice, organisations working through this problem consistently find that the data they thought they had about their own portfolio is less reliable than their records suggest. Addresses that don’t geocode cleanly to a building. Construction type fields that defaulted to “frame” when the field was left blank at policy inception. Roof age recorded as the original structure age – not the date of the last documented replacement.
These are not edge cases. They are endemic to how property data enters and persists in policy administration systems built before data quality was treated as a risk management function.
The Specific Pain Points an AI-Powered Property Risk Assessment Solution Must Address
- Unverified broker-submitted property data: COPE dataConstruction, Occupancy, Protection, and Exposure – the four core property attributes carriers collect to set underwriting terms. Accuracy of these fields directly determines whether the policy is correctly priced. arriving via broker submissions is frequently incomplete, outdated, or inaccurate. Carriers price on representations they cannot verify in the time available.
- Submission volume beyond assessment capacity: When review capacity cannot match inbound volume, properties move toward binding without meaningful risk review. This isn’t inefficiency – it’s systematic adverse selection operating at scale.
- Replacement cost errors compounding at renewal: Replacement cost value (RCV)The estimated cost to rebuild a property to pre-loss condition using current materials and labor at today’s prices – distinct from market value. Under-estimating RCV is the primary source of co-insurance shortfalls at claims time. calculated on outdated property data creates under-insurance that only surfaces at a total loss claim – when it is too late to correct.
- Climate hazard data that doesn’t move at the speed of actual hazard change: Wildfire perimeters, flood zone remappings, and hail corridor shifts happen continuously. Annual data reviews and static policy-period assessments cannot track them between renewal cycles.
- Inconsistent scoring across underwriting teams: Without a standardised AI underwriting assessment tool, two underwriters evaluating the same property reach materially different conclusions. Over a large book of business, this variance creates unexplained loss ratio differences that are difficult to diagnose and impossible to systematically correct.
- No portfolio-level concentration visibility until losses prove it: Individual property assessment produces no signal about geographic risk accumulation. Concentration in high-hazard zones becomes visible only after the event that makes it expensive.
Why AI-Powered Property Risk Assessment Solution Projects Fail Before Solving Any of This
The insurance industry has spent significantly on AI property tools over the past five years. Most implementations have underperformed. Understanding why requires honesty about what actually goes wrong – because the failure modes are predictable, and ignoring them while planning a new implementation guarantees repeating them.
- Generic AI doesn’t understand property: Buildings are physical objects with material-specific failure patterns. Water damage in a timber-frame wall behaves differently from water damage in a masonry cavity wall – structurally, in repair cost, and in time-to-failure. A model trained on general image datasets doesn’t know this. It pattern-matches pixels. When it encounters a property condition it hasn’t seen in training data, it produces a confident wrong answer. The fix is domain-specific training data – labeled by tradespeople and loss adjusters who understand cause-to-damage-to-repair-cost chains, not just image annotators who can identify “roof” vs. “not roof.”
- Outdated imagery producing wrong scores: One carrier nearly lost a major book of business because a free satellite feed showed tarp-covered roofs on properties that had been fully repaired eight months earlier. The model scored them as high-risk. The broker moved the account. Imagery currency is not a nice-to-have – it is the foundational validity condition for any score derived from it.
- Legacy system integration killing adoption: Most carriers run policy administration systems built on technology that predates the internet. AI tools that require clean API connections, modern data schemas, or real-time data feeds cannot connect to these systems without a purpose-built middleware layer. Projects that skip this layer produce AI scores that exist in a separate portal nobody checks – because the underwriter’s actual workflow lives in the policy system, not the AI tool.
The Adoption Failures That Kill Property Risk AI Projects
- Black-box scores that underwriters override: A score without evidence gets ignored. “Roof risk: 78/100” produces no action. “Roof risk: 78/100 – missing shingles detected at NW corner and E ridge, imagery date January 2026, 22-year-old structure with no replacement permit on record” produces a phone call to the broker. Explainability is not a regulatory checkbox. It is the adoption prerequisite.
- Business line non-buy-in killing projects that technically work: The most common reason AI implementations fail in insurance is not underfunding or bad technology – it is lack of business line support. An underwriting team that wasn’t involved in selecting or designing the tool will not change their workflow to accommodate it. Change management is an engineering problem with a human solution, and skipping it is expensive.
- Biased training data creating legal exposure: Models trained on historical claims data learn historical patterns – including discriminatory ones. Physical property risk and neighborhood socioeconomic signals are entirely different measurements. Conflating them in a scoring model produces scores that replicate redlining-era patterns in new statistical clothing. This is both bad risk science and active legal liability under fair lending and fair housing frameworks.
- Narrow use cases without enterprise workflow integration: A roof-condition-scoring tool that produces a score and nothing else creates a new step in the underwriter’s workflow without removing an old one. The AI that wins adoption integrates end-to-end into a specific workflow – from submission receipt to scored briefing to logged decision – so it reduces total workflow steps rather than adding them.
What Is an AI-Powered Property Risk Assessment Solution When It’s Built Right?
An AI-powered property risk assessment solution is a data pipeline that answers the question “how risky is this property?” without physically visiting it. It combines multiple data sources, domain-specific AI models, and workflow integration so the answer arrives where the underwriter already works, with the evidence attached.
Satellite imagery is one input. The solution is the full pipeline.
The mental shift that separates implementations that work from those that don’t: this is a data curation and domain knowledge problem with AI as the execution layer. Companies that treat it as an AI-first problem buy a sophisticated tool that produces outputs their organisation can’t use.
Companies that treat it as a data problem first build systems that compound in accuracy and value over time – because every adjuster correction, every claims outcome, every renewal review feeds back into model improvement.
What the Underwriter Experiences With Automated Property Risk Scoring
A submission arrives. Before the underwriter opens the file, the system has already pulled permit records, mapped the property against current hazard layers, retrieved the most recent aerial imagery, and cross-referenced any prior claims. What lands in the underwriter’s queue is not a raw submission – it is a structured briefing: risk score, the specific evidence behind every flag, imagery date, permit history, recommended review action.
Properties within appetite move toward binding with a documented evidence trail already attached. Properties with specific condition flags – a 22-year roof with no replacement permit in a hail corridor, flashing anomalies detected at the chimney, flood zone boundary within 40 metres – get targeted review with the evidence already assembled. The underwriter’s judgment goes to the decisions that need it. Every outcome logs automatically, creating the audit trail that model governance and regulatory examination both require.
That workflow only works because every adjuster correction feeds back into model refinement. The system is not static – it gets more accurate on your specific portfolio with every claims cycle that passes through it.
How Do Real Organisations Use an AI Property Risk Assessment Solution in Practice?
P&C Carrier – Commercial Lines Underwriter With a Submission Queue Problem
Every Monday morning, 80 new commercial property submissions are sitting in the queue. By Thursday, 30 of them will bind – regardless of whether they’ve been properly assessed, because the alternative is losing the relationship with the broker.
An AI property risk assessment software layer changes this by front-loading the assessment work. Before the underwriter opens a single file, the system has retrieved permit history, flagged roof age against known material lifespans, overlaid the property against current wildfire risk scores, and pulled any prior CLUE claims.
Properties that score within appetite get a green-lane briefing. Those with specific condition flags get a structured evidence packet – image date, detected feature, recommended action. Throughput increases. Adverse selection decreases. The underwriter spends their judgment on the decisions that need it, not on data gathering for every submission in the queue.
Regional Mortgage Lender – Climate Exposure in the Collateral Book
The OCC’s climate risk management principles now require banks to assess and document climate-related financial risks in their loan portfolios. The FHFA’s guidance to mortgage servicers is explicit about collateral exposure in climate-vulnerable geographies.
A regional lender holding 35,000 active mortgages needs to demonstrate they understand where their collateral climate exposure sits – and most of them cannot.
A property risk analytics solution maps every collateral address against current flood zone boundaries, wildfire risk scores, and storm surge projections using automated property risk scoring. Properties approaching uninsurability thresholds generate alerts before the annual insurance review cycle.
The lender’s risk team produces a documented exposure report for the OCC examination – showing methodology, data sources, coverage percentage, and flagged concentrations – rather than explaining why they don’t have one. The collateral book is no longer a black box. It’s a managed exposure with continuous monitoring.
Commercial Real Estate Investment Firm – Portfolio Acquisition Due Diligence Under Time Pressure
A 90-property mixed-use portfolio is on the table with a 10-day exclusivity window. Physical inspection of 90 properties in 10 days is impossible. Bidding blind on portfolio insurance costs is how acquisitions become expensive surprises 90 days after close.
An AI property risk platform for real estate investors runs the full address list through automated property risk scoring overnight. Roof condition ratings, flood exposure, wildfire survivability scores, and detected risk features arrive as a portfolio-level report by morning.
Properties that will drive insurance cost increases or face coverage exclusions in the next renewal cycle are identified before the bid is finalised. Hidden insurance cost – the most common post-acquisition financial surprise on property portfolios – surfaces in due diligence where it belongs. The bid reflects actual total cost of ownership, not an estimate that gets corrected after closing.
Want to discuss what this pipeline looks like against your specific data environment and workflow?
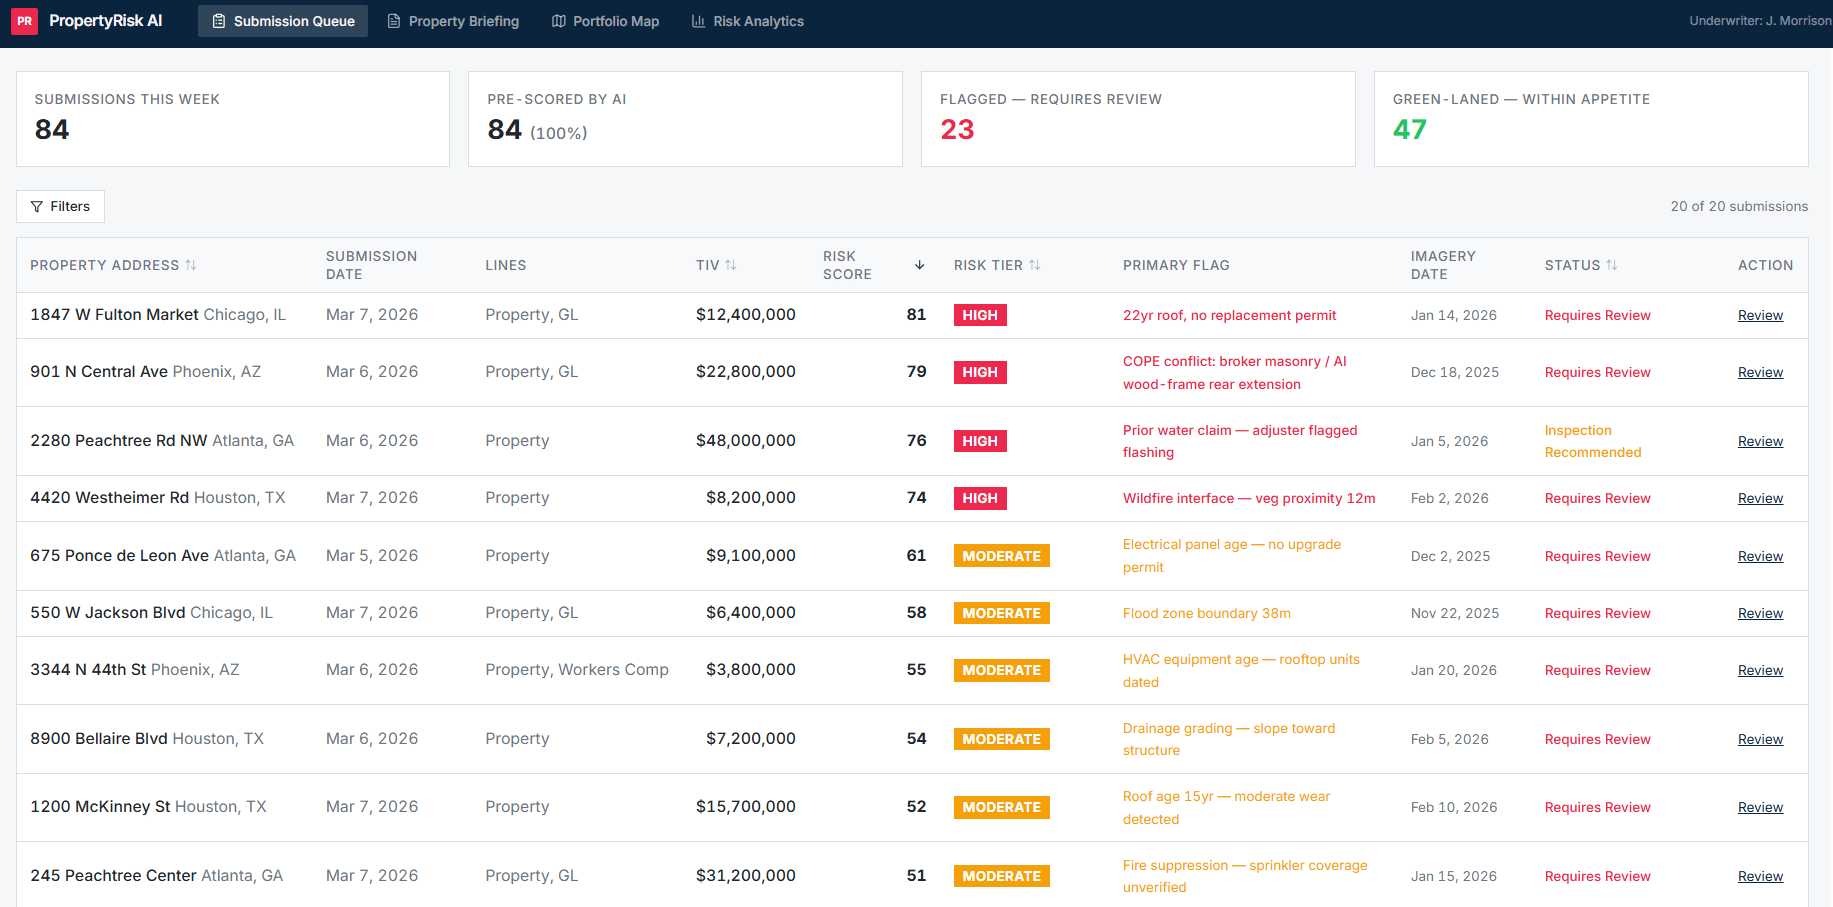
Talk to Our AI TeamProduct Interface Walkthrough
See how the assessment pipeline surfaces risk signals, structures the evidence behind each score, and delivers the briefing directly into the underwriter’s workflow.
How Does an AI-Powered Property Risk Assessment Solution Actually Process Property Data?
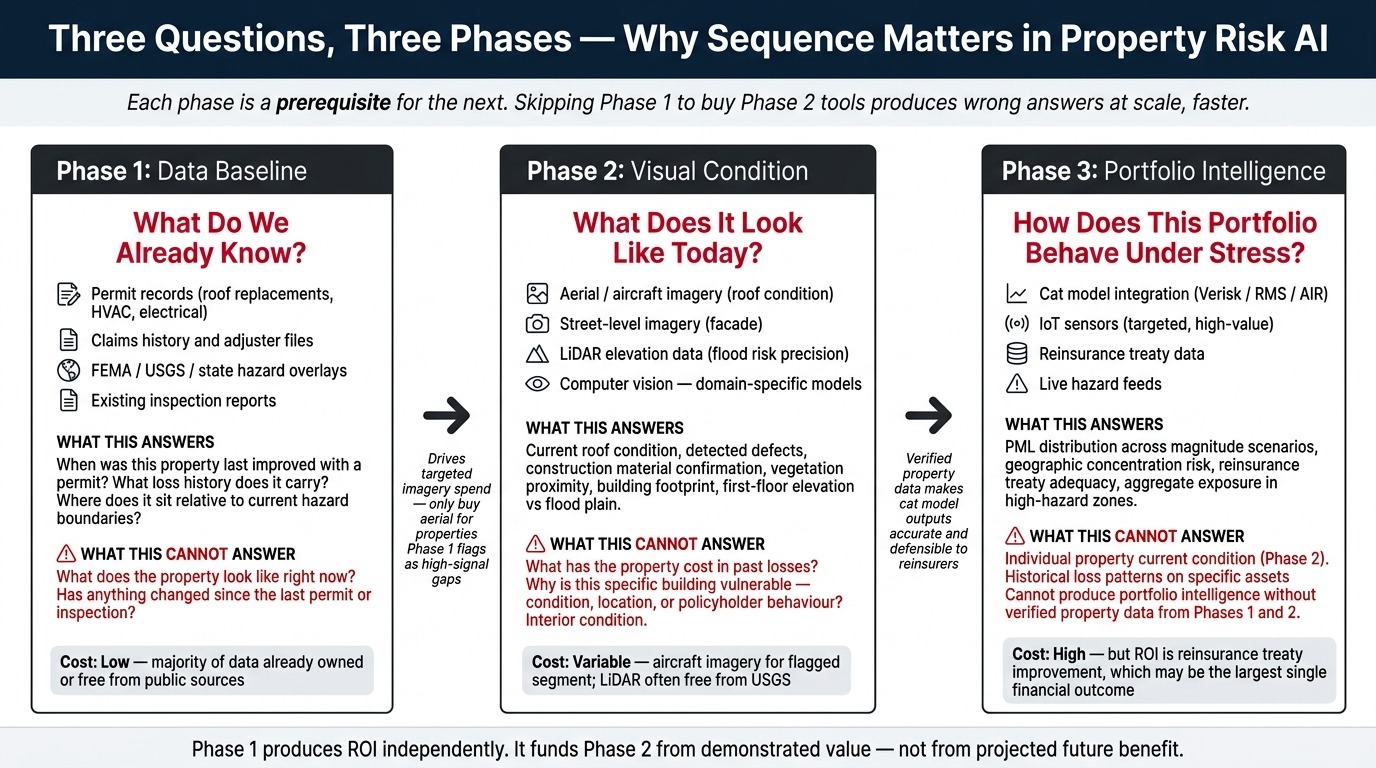
The pipeline moves through four distinct phases – each answering a question the previous phase structurally cannot answer. This isn’t a budget-tier model. Each phase is a genuine prerequisite for the next.
Skipping Phase 1 to buy Phase 2 tools produces Phase 2 tools running on Phase 1-quality data – which means wrong answers at scale, faster.
Phase 1 – Question: What Do We Already Know? (Start Here Before Buying Anything)
Before spending a dollar on imagery or AI models, extract the risk intelligence already sitting in systems the organisation already owns. This phase costs a fraction of what comes later and is the prerequisite that makes everything later accurate.
Public permit records tell you when the roof was replaced – a permit was filed. A roof permitted for replacement three years ago on a property with no prior claims is a materially different underwriting situation from a 22-year-old roof with no replacement permit on record.
This signal costs nothing to obtain and is unavailable from any aerial imagery feed. Permits exist for HVAC replacement, electrical upgrades, structural additions – each a condition signal that imagery cannot see.
Your own claims and loss adjuster files are the most predictive dataset you already own and almost certainly aren’t systematically using. Document AIAI models that read unstructured documents – inspection reports, adjuster notes, appraisals – and extract structured data fields automatically, converting text into queryable property attributes extracts structured condition signals from every past inspection report, adjuster narrative, and appraisal in the system.
A property that had a water intrusion claim six years ago, where the adjuster noted inadequate flashing at the chimney, carries that risk signal forward – but only if someone extracts it from the adjuster’s PDF and attaches it to the property record.
Current hazard overlays from public sources – FEMA flood zone designations, USGS seismic data, state wildfire risk maps – cost nothing and are not systematically applied at the property address level in most carriers’ underwriting workflows. Most operations apply them at ZIP code or postal zone level. Property-level application changes the analysis. Two adjacent properties can sit on opposite sides of a flood zone boundary.
What Phase 1 Produces
What Phase 1 produces: a consolidated, address-verified baseline across the portfolio, segmented by “we know a lot about this property” vs. “we have significant data gaps here.” That segmentation drives Phase 2 spending. You don’t buy aerial imagery for every property. You buy it for the properties where Phase 1 shows elevated signals with unresolved condition questions.
Phase 2 – Question: What Does It Look Like Today? (Visual Condition at Scale)
Phase 1 tells you what historical records say about a property. It cannot tell you what that property looks like right now. Phase 2 closes the current condition gap using imagery – and the choice of imagery source matters significantly depending on what you’re trying to measure.
Manned aircraft aerial imagery is the right choice for roof condition assessment – not satellite. Aircraft imagery captures individual shingle degradation, granule loss patterns, flashing condition, and ridge-line cracking at resolutions that commercially available satellite imagery for property insurance purposes cannot match.
Aircraft capture cycles of once to twice per year per region are sufficient for renewal-cycle underwriting decisions. You need to know current condition before binding a 12-month policy – not minute-by-minute.
Computer visionDeep learning models trained on millions of labeled property images to automatically extract condition assessments, structural attributes, and risk features from photographs – without human review of each image models process this imagery to extract roof condition ratings, material type, building footprint, slope geometry, vegetation proximity for wildfire exposure, and hazard-relevant features.
The critical variable is what those models were trained on. A model trained on millions of labeled property images – labeled by adjusters who recorded actual repair outcomes – produces different outputs than a general computer vision model fine-tuned on a property dataset. Domain-specific training data is the competitive variable, not model architecture.
Street-level imagery adds facade condition data that aerial misses – visible structural deterioration, deferred maintenance indicators, exposed elements, and neighborhood context. For urban residential and light commercial portfolios, run both aerial and street-level. For rural portfolios, street-level coverage is too sparse to be reliable as a systematic tool.
Why LiDAR Is the Most Underutilised Free Data Source
LiDAR (Light Detection and Ranging) – which uses laser pulses to map precise 3D structure geometry – is underutilised and misunderstood. Custom LiDAR acquisition is expensive. But government survey programs have produced LiDAR coverage for large portions of developed markets that is publicly available at no cost.
For flood risk specifically, LiDAR-derived elevation models calculate first-floor elevation above flood plain, drainage catchment area, and which specific buildings in a flood zone sit above vs. below inundation thresholds. For any carrier with coastal, riverine, or urban flood exposure, USGS LiDAR data improves flood scoring accuracy at essentially zero incremental cost.
What Phase 2 produces: per-property current condition scores combined with Phase 1’s location hazard exposure. The combination is what actually predicts loss. A well-maintained roof in a high-hail corridor is a fundamentally different risk from a deteriorated roof in the same corridor.
Phase 1 alone cannot distinguish them. Phase 2 alone without Phase 1’s permit and claims context produces condition scores without history. Together they produce a score with both dimensions.
Phase 3 – Question: How Does This Portfolio Behave Under Stress? (Catastrophe Modeling Integration)
Catastrophe modelingProbabilistic simulation of large-scale natural disaster scenarios across thousands of modeled events to estimate expected and worst-case losses for an insurance portfolio – the primary tool for reinsurance structuring and regulatory capital calculations integration is where individual property risk intelligence becomes portfolio-level financial intelligence. This is the phase that directly affects reinsurance treaty pricing, regulatory capital requirements, and aggregate PML limitsProbable Maximum Loss – the estimated worst-case financial loss a carrier would suffer from a single catastrophe event, used to set reinsurance attachment points and required capital reserves.
It is commercially the most significant phase – and the one most commonly attempted before the data it depends on is ready.
Cat models run probabilistic event simulations across a portfolio – modelling hundreds of thousands of scenarios to estimate loss distributions under different disaster magnitudes and tracks. The output quality depends entirely on the accuracy of the property data feeding the model.
COPE data carrying undocumented errors – construction type defaulted at policy inception, roof age carried from original structure rather than last replacement, protection class not updated after fire station relocation – produces PML estimates with structural uncertainty that reinsurers price as an additional risk premium embedded in treaty costs. Verified, AI-scored property data narrows that uncertainty. A carrier that feeds Phase 1 and Phase 2-verified property attributes into a cat model produces PML estimates that are both more accurate and more defensible to the reinsurer across the negotiation table.
The commercial implication is direct: for a mid-size carrier spending $15-25 million annually on catastrophe reinsurance, a meaningful improvement in property data quality and model credibility translates to measurable treaty pricing improvement.
Reinsurers price the uncertainty in your data, not just the underlying risk. Reducing data uncertainty reduces the implicit uncertainty premium in your reinsurance cost. This ROI line almost never appears in AI platform business cases – and it is often the largest single number on the list.
IoT and Continuous Monitoring: Phase 3 for High-Value Properties
IoT and continuous monitoring also sits in Phase 3 for most carriers – not as a portfolio-wide solution but as a targeted tool for the highest-value commercial properties and new construction where sensor adoption can be built into policy terms.
Smart building sensors generating real-time water intrusion, HVAC failure, and environmental data create a live risk signal that no imagery source can replicate. The constraint is adoption – the carrier doesn’t install sensors, the property owner does. Phase 3 makes the business case for sensor adoption incentives credible, because the risk intelligence value is now demonstrated by Phases 1 and 2.
Data Sources in a Property Risk Assessment AI Pipeline: What Each Answers
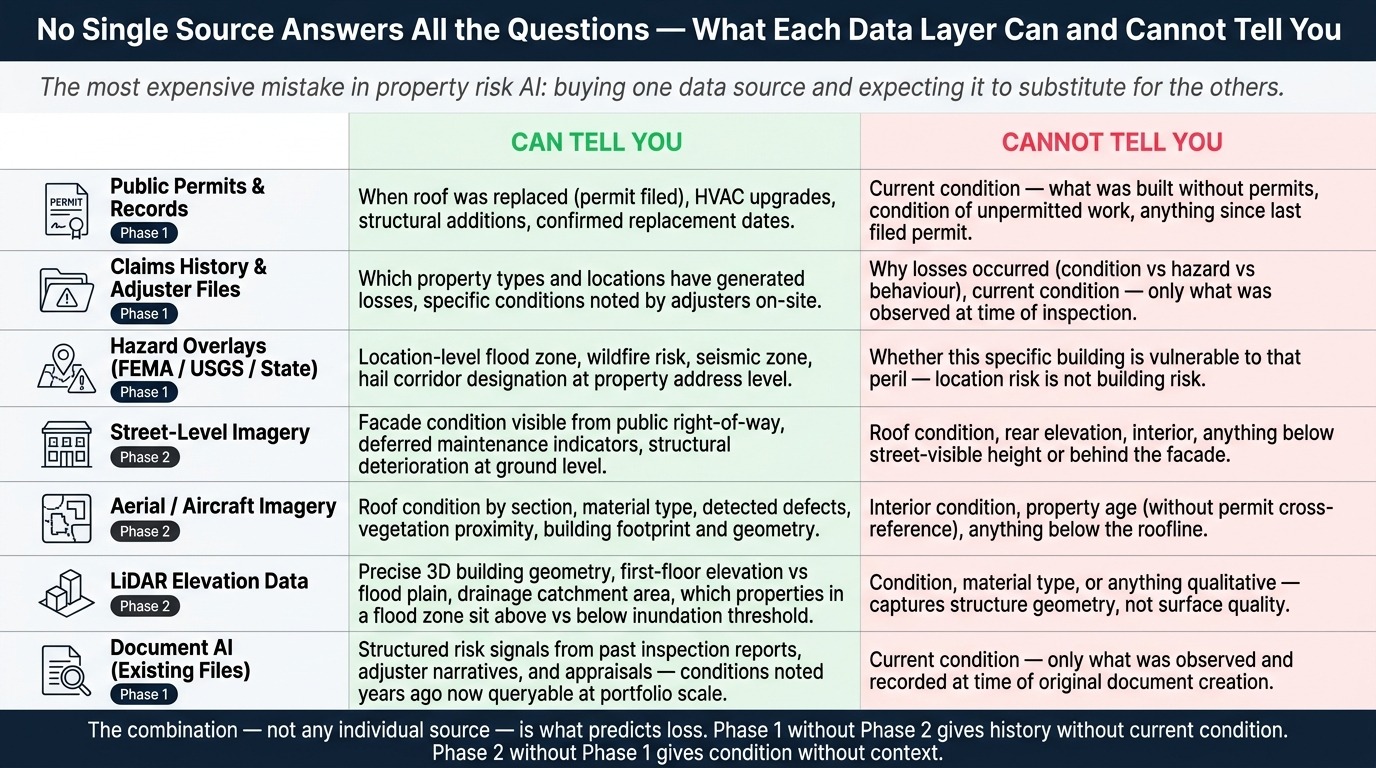
Each data source answers a specific question. No single source answers all of them. Understanding this prevents the most expensive mistake in property risk AI: buying one data source and expecting it to substitute for the others.
- Public records and permit data: What was built, when, what was replaced with a permit. Cannot tell you current condition or what was built without permits.
- Your own claims history: Which property types and locations have actually generated losses. Cannot tell you why – condition, policyholder behavior, or pure hazard.
- Hazard overlays (FEMA, USGS, state sources): Where location-level peril exposure sits. Cannot tell you whether this specific building is vulnerable to that peril.
- Street-level imagery: Facade condition visible from the public right-of-way. Cannot see the roof, rear elevation, or anything below street-visible height.
- Aerial/aircraft imagery: Roof condition, geometry, vegetation proximity. Cannot see interior, age, or anything below the roofline.
- LiDAR: Precise 3D geometry and elevation above flood plain. Captures structure geometry – not condition, material, or anything qualitative.
- Document AI on existing files: What your past inspection reports, adjuster notes, and appraisals actually recorded. Cannot provide current condition – only what was observed at time of the original document.
The AI Property Risk Assessment Pipeline: Six Steps in Production
- Address Resolution and Record Conflict Reconciliation: The first failure point in every property risk pipeline is not the AI model – it is the address. A broker submission may describe “1247 Oak Street Unit 4B.” The permit database has “1247-1249 Oak St #4B.” The aerial imagery provider has geocoded to the building centroid, not the unit. The claims system has a different spelling entirely. Before any scoring begins, the system must resolve these conflicts and anchor every data source to the same verified building-level location. Organisations consistently underestimate the engineering complexity here. In portfolios with legacy policy systems, address normalisation failures silently corrupt a significant share of records – and the corruption is invisible until a score is generated for the wrong property.
- Structured Data Extraction and Gap Mapping: Once addresses are resolved, the system pulls permit records, claims history, and public property records for each location. It simultaneously maps what’s missing – properties with no permit history, no prior inspection data, no hazard overlay match. This gap map drives Phase 2 imagery prioritisation. High-value or high-signal-gap properties get targeted imagery acquisition. The rest get scored on Phase 1 data with appropriate confidence intervals attached to the output.
- Imagery Retrieval and Currency Verification: For properties requiring visual condition assessment, the system retrieves available aerial imagery and records the capture date. Currency matters as much as resolution. A high-resolution image from 18 months ago may miss a roof replacement, storm damage, or new construction completed since capture. The system flags imagery older than a defined threshold for that peril type – hail risk scoring on 14-month-old imagery in a known hail corridor requires a different confidence label than the same score in a low-hail region.
- Domain-Specific Condition Scoring: Computer vision modelsDeep neural networks trained specifically on labeled property inspection imagery to extract condition assessments – distinct from general image recognition models which lack property-domain training data trained on domain-specific labeled property data process the imagery. The model extracts roof condition ratings by section, material type, detected defects, vegetation proximity measurements, and hazard-relevant features. The output is a structured condition record with specific detected attributes – not just a summary score. Each detected feature carries the imagery coordinates that produced it, making the output auditable and explainable.
- Peril-Specific Risk Score Calculation: Where step 4 describes what the property looks like today, step 5 predicts what it is likely to cost. Machine learning modelsAlgorithms trained on historical property loss outcomes to predict future claim probability and severity for a specific property – combining condition signals, hazard exposure, and structural attributes into a calibrated risk estimate trained on the organisation’s own claims history take the structured condition record from step 4, add current hazard layer data, permit history, and portfolio loss experience, then produce peril-specific scores – wildfire survivability, flood vulnerability, wind resistance, hail exposure. Each score reflects what that specific combination of attributes has actually produced in the organisation’s own loss experience. This calibration to your portfolio is what separates a score that predicts your losses from one that predicts some generic carrier’s losses.
- Explainable Briefing Generation and Workflow Delivery: The final stage produces not just a score but the structured briefing the underwriter actually needs. The briefing names each risk flag, shows the evidence source and date, flags properties requiring human review, and delivers everything via API directly into the policy system the underwriter already uses. A vision-language model (VLM)An AI model that processes both images and text together – used here to generate human-readable underwriting summaries from property imagery and structured risk data simultaneously generates the narrative summary in language an underwriter can use verbatim in their decision documentation. The audit trail logs automatically.
Human-in-the-Loop: Where Expert Judgment Stays Essential
The AI pipeline handles data gathering, condition extraction, and initial scoring. It does not handle underwriting decisions – because underwriting decisions in regulated markets carry legal accountability that cannot be delegated to a model.
Human judgment concentrates where it adds the most value: reviewing exception-flagged properties, overriding scores with documented rationale, calibrating appetite thresholds, and catching the edge cases that models handle poorly.
- Exception review: Properties flagged with condition conflicts, imagery currency issues, or scores near appetite boundaries require underwriter review with the assembled evidence. The AI prepares the file. The human makes the call.
- Non-standard property types: Historic structures, bespoke commercial developments, properties built to non-standard methods, and assets in areas with sparse training data coverage all fall outside the model’s reliable operating range. Flag and escalate – don’t score and hope.
- Model calibration: Actuarial and technical teams review scoring model performance quarterly against actual loss outcomes. Drift in model accuracy – as building materials evolve, climate patterns shift, or the portfolio mix changes – requires recalibration. This is a standing operational commitment, not a one-time deployment task.
- Regulatory decisions: Final underwriting decisions in regulated jurisdictions remain human-authorised. The AI scoring pipeline produces evidence-backed intelligence that informs the decision. The underwriter retains full professional and legal accountability for the outcome.
What Technologies Power an AI-Powered Property Risk Assessment Solution – and Why the Combination Matters More Than Any Single One
The technology list for this solution is well-known. The insight that most vendor presentations miss is this: each technology in isolation produces incomplete outputs. The specific value of an AI property risk assessment software stack is what each technology enables the others to do that neither can do alone.
- Computer Vision + Claims-Labeled Training Data – Together: Computer vision alone tells you what a roof looks like in an image. Claims-labeled training data tells the model which roof conditions – in which material types, in which climate zones – have actually produced losses. Without the claims label, you have a description. With it, you have a prediction. This combination is the moat that domain-specific AI builds. Generic computer vision models can describe property features. Only models trained on actual loss outcomes can score them.
- Retrieval-Augmented Generation (RAG)An AI architecture that grounds model outputs in a specific database of real documents rather than generic training data – used here to anchor risk assessments in actual claims records rather than allowing the model to extrapolate beyond its evidence Anchored to Real Claims Data: Large language models (LLMs)AI models trained on large text datasets to generate human-readable language – used here to produce underwriting narrative summaries, not to make risk decisions used without grounding hallucinate. In property risk, a hallucinated repair cost estimate or a fabricated flood zone designation is not an inconvenience – it is a compliance failure and a potential claims liability. RAG constrains model outputs to the specific claims database and regulatory documents the organisation provides. The model cites what it knows. It doesn’t extrapolate what it doesn’t.
- Geospatial AI + Real-Time Hazard Feeds: Static hazard maps produce static risk scores on a world that changes continuously. Wildfire risk boundaries shift seasonally. Flood zone remappings happen after every major survey update. Geospatial AI that queries live hazard data feeds rather than a point-in-time snapshot produces risk scores that reflect current exposure – not the exposure profile from the last time someone updated a database.
Technologies That Determine Whether the System Gets Used
- Middleware Integration Layer + Legacy Policy Systems: The best AI scoring engine in the world produces no business value if it outputs into a dashboard nobody checks. A middleware layer that intercepts data from legacy policy administration systems, routes it through the AI pipeline, and returns scores in the format the legacy system already accepts is not the exciting part of the architecture – it is the part that determines whether the solution gets used. The engineering complexity here is consistently higher than initial estimates, and it is the part most commonly under-resourced in implementations that subsequently fail.
- Explainable AI Frameworks + Regulatory Audit Requirements: Insurance regulators in the United States increasingly require that AI-influenced underwriting decisions be explainable and auditable. The ASTM E3429-24 standard for Property Resilience Assessments formalises this for climate risk specifically. State insurance commissioners have issued data calls post-catastrophe requiring carriers to demonstrate how they assessed exposed properties. Explainable AI is not a feature. It is the compliance requirement that determines whether the output of the scoring model is legally usable in underwriting decisions.
- Feedback Loop Architecture + Continuous Model Improvement: A scoring model deployed without a feedback mechanism is a static tool in a changing world. Every adjuster correction – “model flagged this roof as high risk, inspection confirmed it was replaced 18 months ago without a permit being filed” – is a labeled training example. Systems built to capture these corrections and feed them back into model refinement get more accurate on your specific portfolio over time. Systems without this loop drift in accuracy as portfolio composition, climate conditions, and building stock evolve.
What Does a Properly Implemented AI Property Risk Assessment Solution Actually Deliver?
Each benefit below maps directly to a specific failure mode or pain point from the preceding sections. If a benefit doesn’t connect to a real operational problem, it doesn’t belong in an AI-powered property risk assessment solution business case.
- Underwriting decisions backed by verifiable evidence: The shift from “the model says 78” to “the model says 78 because of these specific detected conditions from this image date” is the shift from a tool underwriters override to a tool they use. Adoption follows explainability. Loss ratio improvement follows adoption.
- Full submission queue assessment without headcount growth: When automated property risk scoring covers 100% of inbound submissions before the underwriter opens a file, the adverse selection engine created by partial review closes. The 60% of submissions that previously moved toward binding without assessment now get a scored briefing attached before anyone touches them.
- Replacement cost accuracy that holds at claims time: AI-verified property attributes – confirmed square footage, construction type, roof material, structure age – feed directly into replacement cost calculation. The gap between insured value and actual replacement cost that surfaces at total-loss claims becomes measurable and correctable before binding, not after.
- Consistent scoring that eliminates unexplained loss ratio variance: When every underwriter on every team works from the same AI-generated evidence base, the unexplained loss ratio variance between underwriters and regions shrinks. Portfolio composition becomes predictable. Pricing assumptions become testable against actual outcomes.
Portfolio-Level and Compliance Benefits
- Climate exposure that moves as fast as actual climate change: An automated property risk platform with live hazard data integration tracks wildfire boundary shifts, flood zone remappings, and emerging peril corridors between annual review cycles. Climate risk exposure is no longer a point-in-time estimate. It is a continuously maintained view of the portfolio.
- Reinsurance cost improvement from better cat model inputs: Verified property data feeding into catastrophe models produces PML estimates that are more accurate and more defensible to reinsurers. The uncertainty premium embedded in reinsurance treaty pricing reflects data quality. Better data reduces that premium. For carriers with significant catastrophe reinsurance spend, this may be the largest single ROI line.
- Regulatory examination preparedness built into normal operations: An audit trail of every AI-assisted underwriting decision – score, evidence, underwriter action, outcome – is what state insurance commissioners and federal banking regulators are increasingly asking for. Building this into the standard workflow means examination preparation costs are near zero, because the documentation already exists.
What Is the ROI Case for an AI-Powered Property Risk Assessment Solution – Built Honestly
The ROI case closes fastest when built from the cost of the current state – not projected savings from a vendor model. Start with your own numbers, because the cost of your current bad outcomes is almost always larger than pre-implementation analysis suggests. Measuring it precisely is the most persuasive argument available.
The Cost of the Current State – Five Numbers to Measure
- Adverse selection cost: What is one point of loss ratio worth in your premium base? If you write $400M in property premium, one loss ratio point is $4M. How many loss ratio points are plausibly attributable to pricing decisions made on unverified or incomplete property data? This is an internal actuarial question your team can answer using your own data – and the answer is usually larger than the number anyone initially assumes.
- Submission queue leakage: What percentage of submitted properties receive meaningful risk review before a binding decision? What is the annualised premium value of submissions that bind without assessment? A carrier that binds 20% of its book without meaningful review and then charges average-portfolio pricing to that segment is systematically underpricing the subset that skews toward worse-than-average risk.
- Inspection cost per assessed property: The fully loaded cost of physical inspection – including scheduling, travel, report preparation, and underwriter review time – per property in your current assessment workflow. This is the cost the AI-powered property risk assessment solution replaces for standard property types, concentrating physical inspection budget on the properties where site visits add irreplaceable value.
- Reinsurance uncertainty premium: Work with your reinsurance broker to estimate how much of your current catastrophe treaty cost reflects uncertainty in your property data quality. This requires a direct conversation with your reinsurer and is not always accessible. But for carriers with $15M+ in annual cat reinsurance spend, even a 5-10% improvement in treaty pricing from better-documented property data is a meaningful number.
- Regulatory examination cost: The fully loaded cost of preparing for state insurance department examinations, rate filing documentation, and fair lending compliance reviews that currently require manual document assembly. Systems that produce audit trails automatically substantially reduce the manual assembly burden – examination still requires human preparation, but the documentation exists and is queryable rather than being reconstructed from scratch under time pressure.
Implementation and Payback Timeline – Realistic Expectations
What implementation experience reveals that theoretical timelines consistently understate is the integration phase duration. The AI models – even domain-specific ones – are not the long pole in the implementation tent. Getting data from legacy policy systems, through the AI pipeline, and back into the systems underwriters actually use is.
Plan for six to twelve weeks of middleware integration work for a carrier on standard policy administration infrastructure. This is not failure – it is the reality of connecting modern AI to systems built for a different era.
The phased implementation approach – Phase 1 data baseline, then Phase 2 imagery for the flagged segment, then Phase 3 cat model integration – manages this by producing ROI at each phase rather than requiring full implementation before any value is realised. Phase 1 alone typically reduces COPE data error rates and improves renewal pricing accuracy. It funds Phase 2 from demonstrated value, not from projected future benefit.
The business case for acting before a major loss event is straightforward: every year without property-level risk intelligence is a year of accumulating exposure you cannot measure. The portfolio that lacks this visibility today binds mispriced risk continuously. The model that calibrates on your claims history this year becomes more accurate next year. Waiting defers both the cost reduction and the compounding accuracy improvement.
What Does Implementing an AI-Powered Property Risk Assessment Solution Actually Require in Production?
The gap between a convincing demo and an AI-powered property risk assessment solution that underwriters use every day is where most projects end. These are the non-negotiable production requirements – not blockers, but engineering and organisational commitments that determine whether the system works or gets shelved.
Technical Requirements for Property Risk AI in Production
- Address standardisation and geocoding infrastructure: Every data source in the pipeline must anchor to the same physical building. This requires an address standardisation process that normalises broker submissions, policy system records, permit databases, and imagery provider geocodes to building-level precision – not street midpoint approximations. This is foundational engineering that must be solved before any AI scoring produces reliable results.
- Legacy system middleware – the real integration challenge: Most carriers run policy administration platforms that predate modern API standards. The AI layer must consume whatever format those systems produce – flat file exports, SFTP transfers, batch jobs – and return outputs in the same format. Rip-and-replace of legacy systems to accommodate AI tools is not a viable plan for most organisations. Wrap and extend is. Design the integration layer for the systems that exist, not the systems you wish you had.
- Imagery currency policy: Establish explicit rules for which peril types require imagery below what age threshold before a score is considered reliable. Hail risk scoring on 18-month-old imagery in a known hail corridor requires different handling than wildfire scoring in a low-change zone. Publish these thresholds internally and attach confidence labels to scores that approach or exceed them.
Governance and Organisational Requirements
- Fairness architecture from day one: Separate physical property risk signals from neighborhood socioeconomic proxies at the model design stage – not as a post-deployment patch. Roof condition, construction type, and structural integrity are physical measurements. Crime rate, median income, and neighborhood demographic data are socioeconomic measurements. They predict different things. Combining them in a single risk score produces a model that conflates two different questions and answers both poorly – while creating regulatory and legal exposure. Run counterfactual fairness tests: does the model produce different scores for physically identical properties in different ZIP codes? The answer must be no.
- Business line champion before technology deployment: The underwriting team that was not involved in selecting or designing the tool will not change their daily workflow to accommodate it. Identify the one underwriter or claims lead who is already frustrated with the current process and make them the internal champion before deployment begins. Design the workflow around how they actually work, not how the system would prefer them to work. Adoption is an organisational design problem. Engineering alone does not solve it.
- Model governance and recalibration commitment: Define quarterly model performance reviews and annual recalibration cycles as standing operational commitments before deployment. Document training data sources, known coverage gaps, demographic representation, and performance metrics in a model card. This documentation is increasingly required by regulators and will be examined. Building it into normal operations is significantly cheaper than assembling it retroactively under examination pressure.
- Feedback loop implementation: Design the system to capture adjuster corrections and underwriter overrides as labeled training data from day one. Every correction is a domain-specific signal. Systems that capture these signals and feed them back into model refinement improve in accuracy over time on the organisation’s specific portfolio. Systems without this mechanism are static tools in a changing world.
Where AI Property Risk Assessment Has Documented Limits
- Aerial imagery analysis cannot assess interior property conditions – electrical systems, plumbing integrity, structural load-bearing elements, HVAC condition, or any hazard inside the building envelope. For high-value or complex properties, physical inspection of interior conditions remains irreplaceable.
- Domain-specific scoring models perform most accurately on the property types and geographic regions well-represented in their training data. Unusual property configurations, historic structures, non-standard construction methods, or regions with sparse historical loss data produce less reliable outputs and should be flagged for enhanced human review.
- Forward-looking climate projections embedded in risk scores are probabilistic estimates. They are directional inputs for portfolio strategy – not precise predictions of individual property outcomes. Using them as certain forecasts rather than probability distributions will eventually produce decisions that look unreasonably confident in retrospect.
- No AI property risk assessment software eliminates the need for human judgment in underwriting decisions. It changes where judgment is applied – from routine data gathering to genuine risk exceptions and portfolio strategy. Teams that expect to reduce underwriting headcount substantially through AI implementation typically find that headcount shifts toward higher-value activities rather than disappearing. The efficiency gain is real. The staffing implication is more nuanced than “fewer underwriters.”
Who Actually Gets ROI From an AI-Powered Property Risk Assessment Solution?
Not every organisation gets the same value from this investment. The ROI scales with portfolio size, submission volume, and how much of the current assessment process relies on manual data gathering that AI can replace. Below that threshold, the integration cost exceeds the efficiency gain.
The highest-value applications are property and casualty carriers managing commercial lines books with high submission volume in catastrophe-exposed geographies – specifically where the current assessment gap creates measurable adverse selection in the renewal book.
Residential and commercial mortgage lenders holding climate-exposed collateral portfolios under FHFA or OCC climate risk guidance have a compliance driver that makes the business case straightforward. Commercial real estate investment firms that conduct regular portfolio acquisitions under time pressure get specific, measurable value from compressed due diligence cycles. Reinsurers and capacity providers evaluating treaty structures benefit from portfolio-level exposure data that this solution makes possible.
This solution produces clear ROI if:
Four Signals That Property Risk AI Has a Strong Business Case
- Your underwriting team’s submission volume consistently outpaces meaningful risk review capacity – where properties routinely move toward binding without condition assessment because the queue cannot be cleared in the time available
- Your portfolio holds meaningful exposure in wildfire interface zones, coastal flood areas, hail corridors, or other perils where physical condition significantly affects loss probability and where you currently lack property-level condition data at scale
- Your loss ratio analysis shows unexplained variance by underwriter, region, or submission source that you cannot attribute to legitimate risk differences – a signal that pricing inconsistency from inconsistent assessment is embedded in the book
- You face regulatory or lender requirements to document climate risk exposure in your collateral or underwriting book and currently lack a systematic methodology for producing that documentation
Questions About AI-Powered Property Risk Assessment Solution Implementation – Answered Directly
Implementation and Technical Questions
Our last AI project failed in production. Why would this be different?
The most common reasons property AI implementations fail are predictable and fixable: outdated imagery producing wrong scores, black-box outputs that underwriters override, integration layers that don’t connect to legacy policy systems, and models trained on generic data that doesn’t understand property materials and failure patterns.
A correctly structured implementation addresses each of these before deployment, not after. This means starting with a data quality baseline before buying imagery tools, designing explainable outputs from the architecture stage, building middleware for the legacy systems that actually exist, and using domain-specific training data labeled by people who understand how buildings actually fail. These aren’t optimizations – they are the prerequisites that determine whether the system gets used or gets shelved.
How do we explain an AI-generated risk score to our regulator or to a policyholder who disputes it?
A properly built AI underwriting assessment tool produces a score with evidence attached – not just a number. The output includes which specific property conditions were detected, from which imagery source on which date, against which hazard data layer, with which model version.
“Roof risk score: 78 because missing shingles detected at NW quadrant and E ridge, aerial imagery date January 2026, 23-year structure with no replacement permit on record” is an explainable, auditable, and disputable score. The ASTM E3429-24 standard for Property Resilience Assessments formalises this evidence standard for climate risk specifically. A score without this evidence chain is not defensible to a regulator and will not survive a serious dispute from a sophisticated policyholder.
Do we need satellite imagery to get started, or is there a lower-cost way into this?
The most cost-effective entry point is not satellite – it is the data you already own. Public permit records, your own claims history, existing inspection reports, and free government hazard data sources (FEMA flood zones, USGS LiDAR, state wildfire risk maps) cover a significant share of the risk intelligence gap at minimal cost.
Document AI applied to your existing inspection and adjuster files extracts structured condition signals from documents that were captured years ago but never systematically used. This Phase 1 baseline – which can be implemented in weeks rather than months – already produces measurable improvements in COPE data accuracy and renewal pricing consistency before spending anything on imagery.
Aerial imagery for targeted high-risk segments follows in Phase 2, funded by Phase 1 ROI. Satellite is one data source in a multi-source pipeline. It is not the starting point for most organisations.
Governance, Compliance and Bias Questions
How does AI-powered catastrophe risk modeling for insurers differ from what we’re already doing with standard cat models?
Standard catastrophe models produce output quality proportional to the property data quality feeding them. Most carriers feed cat models with COPE data that includes significant error rates from broker submissions, default field values in legacy systems, and property attributes that haven’t been verified since the policy was first written.
An AI-powered property risk assessment solution improves cat model outputs by improving the property data that feeds them – verified construction type, confirmed roof material and age, validated square footage. The practical consequence is PML estimates that are more accurate, more defensible to reinsurers, and less likely to contain hidden uncertainty that reinsurers price as an additional risk premium. For carriers with significant catastrophe reinsurance spend, this is the ROI argument that most often surprises finance teams when they see the numbers.
How do we prevent the AI scoring model from replicating bias against certain property locations or communities?
This requires architectural decisions made at model design time, not patches applied after deployment. The core principle is to separate physical property risk signals from neighborhood socioeconomic proxies. Roof condition, construction type, and structural attributes are physical measurements of the specific property. Crime rates, median income, and demographic data are socioeconomic measurements of the surrounding area.
Using socioeconomic signals as proxies for physical risk produces scores that replicate historical redlining patterns in new statistical clothing – and creates active regulatory liability under fair lending and fair housing frameworks. Counterfactual fairness testing – checking whether identical physical properties in different ZIP codes receive different scores – must run before deployment and repeat on a regular schedule. Model cards documenting training data sources, demographic coverage, and known performance gaps are increasingly required by regulators and should be treated as standing documentation requirements, not optional governance.
Build This Solution With Softlabs Group
Softlabs builds AI-powered property risk assessment solutions around the specific data environment, legacy systems, and compliance requirements each client actually has – not the clean infrastructure a vendor platform assumes you have. This means building the middleware layer that connects to your policy administration system, structuring your own claims history and inspection archive as domain-specific training data, and designing the explainability framework your regulators require.
Our enterprise AI development practice covers the full implementation stack – from Phase 1 data baseline through Phase 3 catastrophe model integration – and the agentic workflow layer that delivers scored briefings into the systems your underwriting team already uses.
The right starting point is a structured discovery conversation: your current data environment, the specific failure modes you’ve already experienced or want to avoid, and a phased implementation roadmap built around one end-to-end workflow that produces demonstrable ROI before expanding scope.
No platform sales pitch. No proof-of-concept that works in demo conditions and breaks in production. A realistic assessment of what your data makes possible, in what sequence, with what integration complexity.